What are Bollinger Bands?
Named after John Bollinger, a technical analyst who developed them in the 1980s, Bollinger Bands identify the volatility level for a currency pair. As a sudden increase in volatility could predict a trend reversal, Bollinger Bands are placed over a price chart to define pricing "channels".
Bollinger was not the first to research moving averages. However, he was unique in taking the idea one step further by adding bands above and below the moving average line to define upper and lower rate boundaries. These boundaries are then used to measure volatility.
Bollinger Bands Calculation
Before we go into the numbers, remember we've already done the hard work for you. All you need to do is log in to your trading account and add Bollinger Bands analysis directly to your chart with a click.

Bollinger Bands consist of 3 simple calculations:
- 1The first or middle Bollinger Band is a moving average of the closing price. For example, to calculate a 20 period moving average you add up the closing prices of an instrument for 20 consecutive days and divide that value by 20.
- 2The second line is the upper Bollinger Band. To calculate the upper Bollinger Band you calculate the Moving Average of the Close and add Standard Deviations to it. For example the upper band formula would be MOV20+(2*20Standard Deviation of Close).
- 3The third line is the lower Bollinger Band. To calculate the lower Bollinger Band you calculate the Moving Average of the Close and subtract Standard Deviations from it. For example the lower band formula would be MOV20-(2*20Standard Deviation of Close).
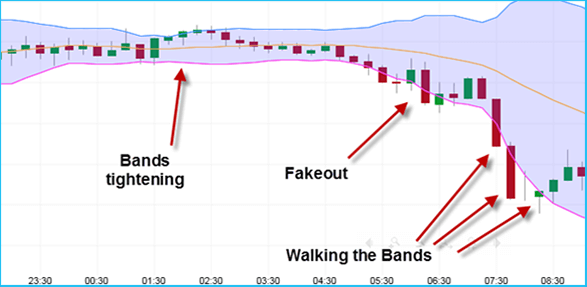
The Bollinger Squeeze
When the bands squeeze together, it usually means that a breakout is imminent.
If the candles start to break out of the top band, then the move will usually continue to rise. If the candles start to break out below the lower band, then the price will usually continue to fall. This strategy is designed for you to catch a move as early as possible.
The Bollinger Bounce
This strategy is for those of us that like to ask for very little from the markets. Essentially, you wait for the market to bounce off the bands back to the middle of the bands.
By not asking for much, you may be able to ultimately reduce the wild fluctuations of your account balance.
How to use Bollinger Bands with other technical indicators
Bollinger and RSI
Bollinger Bands can be a very flexible and adaptable tool. It is very common to combine Bollinger Bands with other indicators; the Relative Strength Index (RSI) can help confirm a trend's relative strength.
The RSI is a momentum indicator that compares the number of days an instrument closes up versus closing down. These values are then ranged from 0 to 100, with overbuying typically expected when the RSI returns a value of over 70 and oversold securities are expected when the value is under 30.
For example, if an instrument price reaches the upper band of a Bollinger Band price channel and, at the same time, the RSI reads 70+, you could discern that the instrument is overbought, and then sell the instrument.
Suppose instead the price chart shows trading is reaching the lower Bollinger Band and the RSI is not under 30. In this case, the RSI is telling us the instrument may not be oversold as the Bollinger Bands seem to indicate, since the downtrend could continue. If the RSI is high enough, you can consider a sell.
Bollinger and MACD
MACD is typically used to reveal whether an instrument is overbought or oversold, which generally hints at an upcoming trend reversal. A popular trading strategy that utilizes the MACD's power is trading divergences. When you see new highs in the instrument's price but not on the MACD, it may indicate the momentum behind the higher prices is waning, and prices will soon adjust.
Bollinger Band signals and strategies (walking the Bands, M-Tops, W-Bottoms and Reversals)
Walking the Bands (sometimes referred to as Riding the Bands)
As Bollinger puts it, moves that touch or exceed the bands are not signals, but rather “tags”. A move to the upper band shows strength, while a sharp move to the lower band shows weakness. Prices can “walk the band” with numerous touches during a strong uptrend. It takes a pretty strong price move to exceed an upper band. Just as a strong uptrend produces numerous upper band tags, it is also common for prices to never reach the lower band during an uptrend.
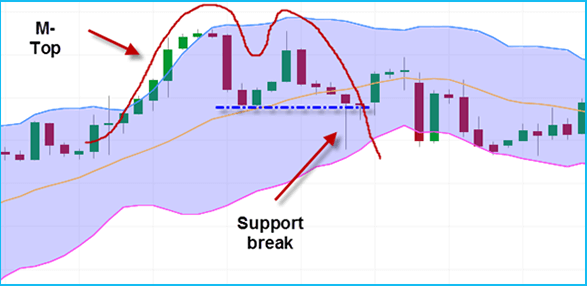
M-Tops
In its most basic form, an M-Top is similar to a double top. However, the reaction highs are not always equal. The first high can be higher or lower than the second high. Bollinger suggests looking for signs of non-confirmation when an instrument is making new highs. This is basically the opposite of the W-Bottom. A non-confirmation occurs with three steps. First, an instrument forges a reaction high above the upper band. Second, there is a pullback towards the middle band. Third, prices move above the prior high, but fail to reach the upper band. This is a warning sign. The inability of the second reaction high to reach the upper band shows waning momentum, which can foreshadow a trend reversal. Final confirmation comes with a support break or bearish indicator signal.
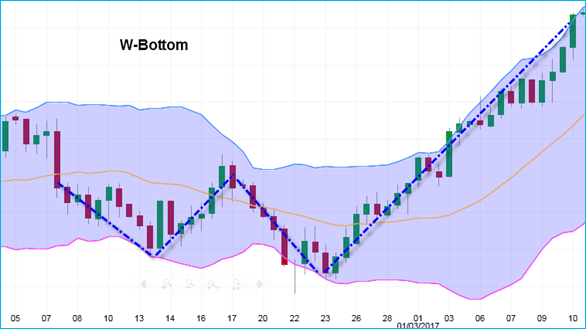
W-Bottoms
A “W-Bottom” forms in a downtrend and involves two reaction lows. In particular, Bollinger looks for W-Bottoms where the second low is lower than the first, but holds above the lower band. There are four steps to confirm a W-Bottom with Bollinger Bands. First, a reaction low forms. This low is usually, but not always, below the lower band. Second, there is a bounce towards the middle band. Third, there is a new price low in the instrument. This low holds above the lower band. The ability to hold above the lower band on the test shows less weakness on the last decline. Fourth, the pattern is confirmed with a strong move off the second low and a resistance break.
Reversals with Bollinger Bands
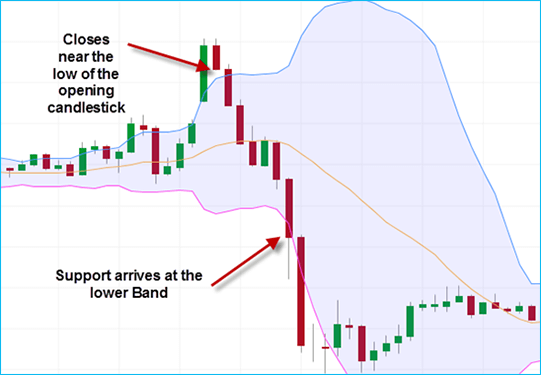
Another noticeable characteristic of Bollinger Bands is instruments fading when they go outside of the bands. Now, take that one step further and apply a little candlestick
analysis to this situation. For example, instead of
shorting an instrument as it gaps up through the upper band limit, wait to see how that instrument performs. If the instrument gaps up and then closes near its low and is still completely outside of the Bollinger Bands, this is often a good indicator that the instrument will correct itself in the near-term.
A quick word of caution
Kindly remember that the Bollinger Bands indicator relies on theory, not fact. While many traders use this technical indicator, others choose different indicators, or different types of trading strategy altogether, and it's completely up to you to decide if you want to use Bollinger Bands - and to what extent.
How can you put all this newly acquired knowledge into use?
Check out the amazing tools we offer for traders of all levels:
iFOREX key features
- Live charts per instrument with full analysis tools.
- Trading tools for traders of all levels.
- More than 750 tradable CFDs on Shares, Commodities, Indices and Currency pairs.
- Legally binding Negative Balance Protection to avoid losses that exceed your balance.

 Years active


 A beginner's e-book
 $5,000 practice demo account
 A 12-part video course
 Trusted partner
 Featured partner