Listed on 
Listed on Years active
Knowledge about trading and the market is extremely important for online traders. There is always more to learn and, by expanding your understanding of different concepts and strategies, you improve your ability to make informed trading decisions. In previous articles, we’ve covered online trading basics, but now we’re moving to the next level by discussing technical analysis. Are you ready to discover this new and popular trading strategy? You better be, because we’re starting right now...
The basic idea behind technical analysis is quite easy to understand. This is a method through which traders use historic price movements to try and predict future price movements. We don’t know if history really does repeat itself, but according to technical analysis, price movements do tend to repeat themselves and - according to the technical analysis theory - they move in certain patterns that can be tracked and recognized.
When you trade online (or offline for that matter), you will often come across the term ‘market trend’. What is a trend? In simple words, it’s the general direction of the price movement of an instrument, or of a specific market. How long does a trend take? It differs. Depending on the timeframe, trends can last years or minutes, but the accepted common classifications are short term, midterm or long term. Because the market only has two directions - up or down - trending can be described in one of two ways; either a ‘bull market’ or a ‘bear market’. What do these animals have to do with trading? Hang on, we’re just getting to it…
You have probably heard the terms ‘bull market’ and ‘bear market’ before. They’re commonly used in financial news and market analysis. Here is a quick explanation of what they mean.

Bull market
A bull market is a financial market in which prices are either rising or expected to rise. This type of market is often characterized by ‘optimism’ and a feeling of general confidence among traders. Traditionally, when people said ‘bull market’, they meant the stock market, but today the term is also used to describe commodity and currency trading.

Bear market
Bear market is the opposite of a bull market. In such a market, prices are either falling or expected to fall. A bear market is characterized by general pessimism and a feeling of instability and uncertainty among traders.
Why bull and bear? There are many answers to this question and, while none are proven - and probably most of them are fictional - our personal favorite is how these animals attack. A bull will push its horns up. A bear will swipe its body down. This reflects the market movements: Up during bull market, down during bear market. Makes sense, right?
Bull and bear markets can be used, in theory, as financial indicators. For example, the beginning of a bull market is viewed by some as an indicator of economic expansion. The beginning of a bear market is seen by some as an indicator of economic contraction. Why? Because traders’ sentiment regarding future economic conditions affects share prices.
We hope we don’t need to tell you that optimism and pessimism are subjective terms, making it difficult to know when trades will change. However, no matter what theory or trading strategy you choose to follow (you might choose more than one), psychology and sentiment are always part of the factors that move the markets. Traders need to remember this when making decisions.
We promised we would explain more about chart types and we intend to deliver. Don’t let the patterns and all the numbers scare you. Albert Einstein once said “Do not worry about your difficulties in mathematics. I can assure you mine are still greater”, and we certainly share the sentiment. You don’t need a degree in economics or mathematics to understand charts and even be able to make basic calculations. Give us a few minutes and we’ll show you it’s easier than you think.
There are many chart types available online and there’s no chance in the world we’ll go through all of them. However, we will cover the most popular and commonly-used charts, just to give you a basic idea of some of your standard options.
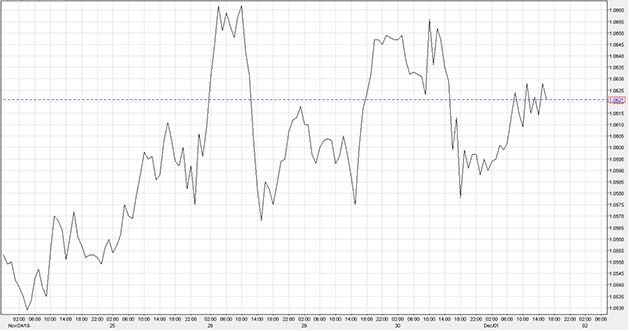
Line chartWe’ll start with a line chart because, let’s be honest, it’s the easiest one to understand. It’s simply a line following the price movement… that’s all. The line is drawn from a specific closing price to the next closing price. It offers a nice overview of price movement across time.
Want to see an example of a line chart? Here you go…
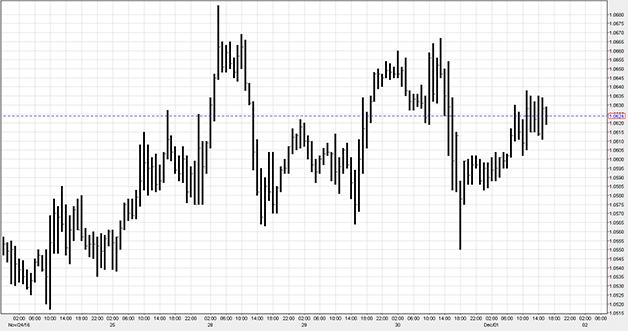
A bar chart isn’t much more complicated than a line chart, but it includes more information. What do we mean? Each ‘bar’ shows not only the opening and closing prices, but also the relevant highs and lows. The bottom of the vertical bar indicates the lowest traded price for that time period, while the top of the bar indicates the highest price paid. The opening price is located on the left side of the bar, while the closing price is on the right side. Here’s a visual explanation:
What is a ‘bar’? A single segment of time. It can be an hour, a day, a week or a month. In some cases, it could mean 15 or even 5 minutes.
Here is an example of a bar chart.
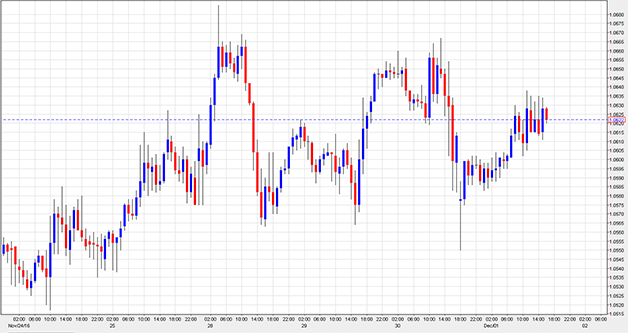
We hope you’ll agree that the first two types of charts we’ve covered were pretty clear. Now, let’s discuss a third, and a slightly more complex chart-type called a ‘candlestick’.
Candlestick charts actually feature the exact same information as bar charts, they just display the information differently. A vertical line shows the price range – highest to lowest. The difference is that the middle section of a candlestick chart shows the difference between the opening and closing rates. Usually, if the center “candle” section is filled, the asset closed lower than it opened. If it’s “empty”, it closed higher than it opened. However, in some cases, a different indicator can be used (e.g.: different colours), as you can see in the example below.
Now that we understand market trends, let’s get down to the most interesting question of them all: How to tell when a trend is changing? Well, you have to start by looking at support and resistance. According to technical analysis – which, we remind you, is theoretical, not factual - support and resistance represent price levels from which a specific instrument rarely moves above (resistance) or below (support).
Confused? Here’s a cute diagram we made, just for you.
The idea behind this theory is quite clear and it all comes back to the psychological aspects of trading, as well as supply and demand. Support and resistance are the price levels at which many investors are willing to sell the instrument (if we’re dealing with resistance) or buy it (if we’re dealing with support).
In some cases, it might look as if a support or a resistance level has been broken, but later on, you’ll discover that the market was only “testing” it. In theory, the more “tests” that fail to break a resistance or support level, the stronger the resistance or support is. Remember though: Support and resistance are levels – not actual prices.
By understanding these levels and following them, you should - according to technical analysis theory - know when to buy and when to sell.
Understanding the concept of trading volume
This is a very important concept for online traders. It refers to the total quantity of contracts traded for a specified tradable instrument. If we’re talking about shares, for example, the volume is the number of shares that changed hands during a specific trading day. Why should you care about trading volume? Usually, when the volume is higher, the price changes faster, offering more opportunities for online traders. News about new products or acquisitions, surprising quarterly reports and major announcements could all result in a temporary increase in a share’s trading volume.
Understanding the 'Relative Strength Index'
The Relative Strength Index or RSI is an interesting indicator that attempts to assess whether an instrument – or a market - is overbought or oversold. How? Well, without going into the specific calculations, it compares recent losses and gains over a specified period of time. The RSI is commonly classified as a momentum indicator.
A pivot point is an indicator used to determine the market’s trend over specific time frames. Pivot points are used by traders to identify potential ‘support and resistance levels’.
How do you calculate it? It’s easy: Just calculate the average of the high, low and closing prices of the previous day’s trading. In theory, if the following day features trading above the pivot point, it indicates a bullish sentiment. Trading below the pivot point indicates a bearish sentiment.
Who uses pivot points? Mainly short-term traders who attempt to capitalize on small price movements.
MACD stands for Moving Average Convergence/Divergence. Simply put, it’s a trading indicator used in technical analysis of share prices. Theoretically, it’s supposed to discover changes in the direction, strength, duration and momentum of trends in a specific share price. If you think we’re going to lay the math before you now, think again. If you’d like to master the required calculations, just do some more reading and see if this indicator works for you.
The Elliott Wave Principle (not an actual principle of course, just a theory) states that the market has repetitive cycles, theoretically reflecting investor sentiment, which is affected by collective psychology. Theses cycles (aka: ‘waves’) supposedly have patterns. Traders who can identify these patterns could use them to try to predict what the price of an instrument will do next.
There’s more though – of course there is. If this theory could be summarized in one paragraph, it wouldn’t be much of a theory, would it? According to Elliott’s model, prices alternate between an impulsive and a corrective phase. Impulses are shown as a set of 5 lower-degree waves (also alternating between motive and corrective. The 1st, 3rd and 5th waves are impulses; the 2nd and 4th are smaller retraces of the 1st and 3rd waves). Are you still with us? Hang on, we’re almost done. Corrective waves include 3 smaller-degree waves (a five-wave counter-trend impulse, a retrace, and finally another impulse). In bear markets, the pattern is reversed.
If you feel weak and faintish, you’ll be happy to hear this is as deep as we go. You can do some additional reading to get a better understanding of this theory (and criticism of it) and assess whether or not it can actually help you predict the behaviour of financial markets.
A Bollinger Band® is used by some investors to measure the "highness" or "lowness" of a price relative to previous trades. These bands are used as indicators of volatility and can be used to identify patterns. The Bollinger Band is placed two standard deviations from a basic moving average. Prices are high at the upper band and low at the lower band. Now, we know what you’re thinking: “This is pretty straightforward, but how does it help me trade?”
Well, some traders believe that the closer the price moves to the upper band, the more overbought the instrument is and, therefore, the closer the price moves to the lower band, the more oversold the instrument is. According to this theory, when the bands move closer together (“the squeeze”), it signals that volatility is low and potentially high volatility – and hence investment opportunities – lie ahead. When the bands move apart, it’s viewed as a sign of high volatility – meaning that lower volatility and the possibility of trades being exited may lie ahead.
There are additional interesting factors. About 90% of price action takes place between the bands. Any breakouts - above or below - is viewed as a major event. However, these breakouts are not to be confused with trading signals. Breakouts don’t offer any clues regarding the extent - or even the direction - of any future price movement.
All of this, of course, doesn’t mean that Bollinger Bands help YOU trade. This is a theory, which you can choose to accept or reject at will, and even if you do choose to adopt it, Bollinger Bands are usually used in collaboration with other methods, not as a standalone.
A Fibonacci sequence is characterized by the fact that every number following the first two is the sum of the two preceding numbers. An example of a modern Fibonacci sequence would be:
0 , 1 , 1 , 2 , 3 , 5 , 8 , 13 , 21 , 34 , 55 , 89 , 144 , …
After a few numbers, the ratio of any number to the succeeding number is 0.618. Want an example?
34 / 55 = 0.618.
The ratio between alternating numbers is 0.382. Here’s an example:
34 / 89 = 0.382.
Some investors use the Fibonacci retracement levels as support and resistance areas. Fibonacci extension levels are sometimes used as ‘take profit’ levels. Because many people place market orders on these levels, they can sometimes become self-fulfilling prophecies.
Once upon a time, traders actually needed to calculate Fibonacci retracement levels and extension levels, but now, most charting software, including the software you’ll find at iFOREX, offers a Fibonacci tool. Needless to say, we haven’t even scratched the surface of the Fibonacci theory and its implications, but when you dig deeper into the world of trading you will learn more about it and can choose whether or not you’d like to use it.

All of the concepts we’ve covered on this page are related to technical analysis, but unfortunately, this doesn’t mean you now know it all. If you like the idea of technical analysis, learn more about this topic and expand your knowledge. There is a wide variety of tradable instruments waiting for you to choose from, however, it’s up to you to figure out which trading theory you may want to use.
Join iFOREX to get an education package and start taking advantage of market opportunities.
 A beginner's e-book
 $5,000 practice demo account
 A 12-part video course
 Trusted partner
 Featured partner