Listed on 
Listed on Years active
If we had to pick one aspect of online trading that is absolutely crucial to every decision you make, it would have to be volatility. For online investors, a volatile market means both potential risks and an abundance of opportunities. Many traders follow market news and economic calendars in an attempt to recognize potential volatility, benefit from it and stay ahead of the market. In this short article we’ll cover the basics of volatility and explain how you can take advantage of it. Are you ready to get started? Great, let’s go…
Before we discuss the possible implications of volatility for online traders, we need to figure out what it is. If we want to be specific – using as few long words as possible - volatility is a statistical measure of how much the price of an instrument fluctuates over a specific time period. If you find that last definition a tad confusing, here it is in simpler terms: Volatility measures how moody the market is. Is it as peaceful as a lake on a summer day or as hectic as an ocean in a storm? Does the graph stay pretty flat or fluctuate like a rollercoaster? This is really what volatility is about.
Can volatility be risky? Of course it can, because the market fluctuates. But while high volatility carries increased risk, it also carries increased opportunities for investors. You might be thinking “well, volatility is only helpful to me when the market is rising”, but that’s far from being accurate. For online traders, downward trends are just as promising as upward trends, because they can always choose to ‘short’ or ‘long’ their position. Any change in price – up or down – can be viewed as an opportunity. Have no idea what we’re talking about? Let’s do 60 seconds on short and long trading.
Short trading Vs. long trading
When you trade online with iFOREX, you have the opportunity to choose between opening a Buy position (also known as ‘long’) or a Sell position (also known as ‘short’). This means you can trade even when prices are dropping. If you believe prices will rise, open a Buy deal. If you believe prices will fall, open a Sell deal – it’s as simple as that.

Because of short and long trading, online investors can take advantage of any price change – even when the price is falling. This is why any volatility, even a market crisis, can be viewed as an opportunity. Legendary investor George Soros is known as “the man who broke the British bank” after he made a profit of $1 billion during the 1992 Black Wednesday UK currency crisis. He made this profit by shorting the British pound.
Will you make a $1 billion profit? That’s highly unlikely, but by trading in different directions, you open a whole new world of possibilities and can make the most of market movements.

If the following explanation confuses you, you can relax knowing that in most cases you won’t need to calculate volatility on your own. If you do want to know how volatility is calculated though, listen up:
Volatility is the standard deviation or the variance of price changes over a specified period of time.
Got it? Great. Didn’t get it? Don’t worry about it now – you can learn more about calculations after you have some experience as a trader, or when you master technical analysis.
Historical volatility (often referred to as HV) is the realized volatility of a specific financial instrument over a specified period of time. We will not trouble you with the calculation, partly because we don’t have time and partly because the term ‘average deviation’ makes our eyes water. All you need to know for now, is that historical volatility is sometimes used in risk assessment and that it can be compared with implied volatility to determine whether or not prices of options are overvalued or undervalued.
There are numerous factors that can influence the market, both causing and fueling volatility. Let us not forget that there are also different types of volatility to consider. What do we mean? Well, volatility can exist within the global economy, a single market or even a single instrument. It can be a long-lasting phenomenon, going on for weeks and months, or a matter of hours or minutes. So you see, listing the factors that impact volatility can be a bit tricky, as the definition of volatility depends on your point of view. However, if we agree to keep things general, we can offer some examples of factors that could lead to – or boost - volatility:
As we’ve outlined in the previous paragraph, there are many factors with the power to move the market. If you are new to the world of trading, you may think it’s a bit odd that a single event can have such a substantial impact, but when you’re dealing with major political or economic changes, global markets react, and fast. Want a few examples? Not a problem.
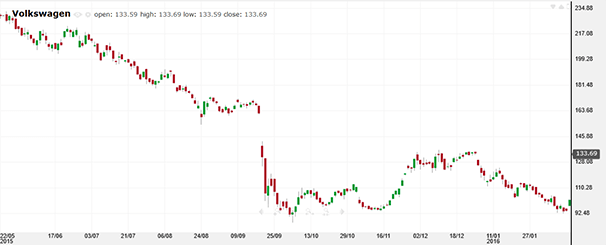
In September 2015 Volkswagen – the world renowned automobile company - landed in trouble – major trouble. It was discovered that the seemingly reliable and honest German automaker cheated on its emissions tests using innovative software. After the company announced a recall of 482,000 vehicles in the United States on September 18th, Volkswagen shares crashed – and badly, as you can see below.
Want another example? Sure – let’s look at currencies.
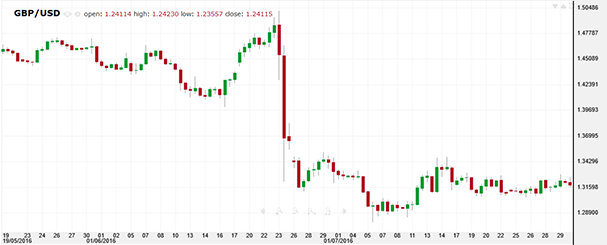
On June 23rd 2016, Britain went to vote on its future in the EU. The surprising results shocked the world, and global markets. Just take a look at what happened to the British Pound, when traded against the US Dollar, on June 24th.
Okay, let’s look at just one last example, this time of a product we all know and use.
Oil has been particularly volatile for several years, but then, on November 30th 2016, OPEC agreed on the first oil production cuts in 8 years. The results of this one single announcement? See for yourself.
As all of these examples show, major events, decisions and - in that last example - agreements can indeed move the market, opening many opportunities for online traders. This highlights the importance of information for traders and proves what we’ve been saying over and over again: The news is an excellent resource for traders. Information about trading is everywhere – you just need to start collecting and understanding it.
Want to gain insight into a few major events that took place today? Check out our daily market news.
Usually, when you say “indices” people imagine the NASDAQ, the Dow Jones or the DAX, but volatility indices are quite different. A volatility index is a tool aimed at measuring volatility in a specific market. There are several indices that measure volatility, but the first one people think about when you mention volatility and index in the same sentence is the one and only VIX, or by the much scarier name: The fear gauge.
The VIX index attempts to measure the implied volatility of S&P 500 index options. If we want to simplify, we would say that it can reflect what people feel about the current and near-future stability of the market. In times of uncertainty and crisis, or when investors are caught off guard by some major economic event, the VIX tends to surge. This fact has given the VIX its reputation as “the fear gauge”, as it is viewed by some investors as being able to measure market fears and anxiety.
There are many different strategies investors use when they trade this unique index. Some people examine the VIX on its own while others prefer the convergence-divergence relationship, where they look at the VIX movements alongside the movements of other indices, such as the S&P 500 or the NASDAQ, in order to make decisions. Is there one strategy that always works? Of course not, but there is a lot of information about this instrument and you can do some additional reading to gain a better understanding of how investors handle it.
At iFOREX, you can trade the VIX in the form of CFDs with leverage, in any direction, and can take advantage of market fears. Not sure where to begin? Visit our Getting Started page.
For the full list of tradable CFD instruments, visit our Trading Conditions page.
As the old adage goes, there's no reward without risk. A lot of trading is done by keeping updated with the news for positive and negative events. When the latter occurs, traders can sell short, forecasting that the value of that instrument will go down to turn a profit for themselves. By expecting those negative events to come that will influence directly or indirectly that instrument, you can make more intuitive trades.
As another adage goes, high risk high reward. You can leverage your instruments when you feel more confident in a certain trade for a greater return. However, it may also result in a greater loss. Therefore, you should use features like Take Profit & Stop Loss to minimize the greater risk involved in leveraging.
Join iFOREX to get an education package and start taking advantage of market opportunities.
 A beginner's e-book
 $5,000 practice demo account
 A 12-part video course
 Trusted partner
 Featured partner